

How to build an interactive map with Leafletjs
How to build an interactive map with Leafletjs

Front-end software engineer and I specialise in Angular🤖. I've been working with it since Angular JS and I like to keep up with new technologies. I love to write about Angular, TypeScript, JavaScript and more 📰. My hobbies are travelling around Southeast Asia ✈️, cars and technology.
This article was born out of a need to make a fully customisable map, after a few searches on open source libraries to do this I found the Leafletjs library.
Lefletjs defines itself as an open source JavaScript library for for mobile friendly interactive maps. One of the benefits is:
Simple and quick to learn
Easy to use
Mobile support
HTML 5 and CSS3
Works in both modern and legacy web browsers
Extensible with plugins
Well-documented API
In this example, I will do it in Angular, but the steps are pretty much the same for any JavaScript framework.
Installation
First, install the leaflet library and leaflet types for use with TypeScript:
npm i leaflet
npm i @types/leaflet
Add the CSS file to your angular.json
"styles": [
    "./node_modules/leaflet/dist/leaflet.css"
],
Creating the HTML and CSS
Add a div with a unique id to render inside the map:
<div class="map-container">
  <div class="map-frame">
    <div id="map"></div>
  </div>
</div>
Add some styles:
.map-container {
    position: absolute;
    top: 0;
    left: 0;
    right: 0;
    bottom: 0;
    margin: 30px;
  }
  .map-frame {
    border: 2px solid black;
    height: 100%;
  }
  #map {
    height: 100%;
  }
The JSON data
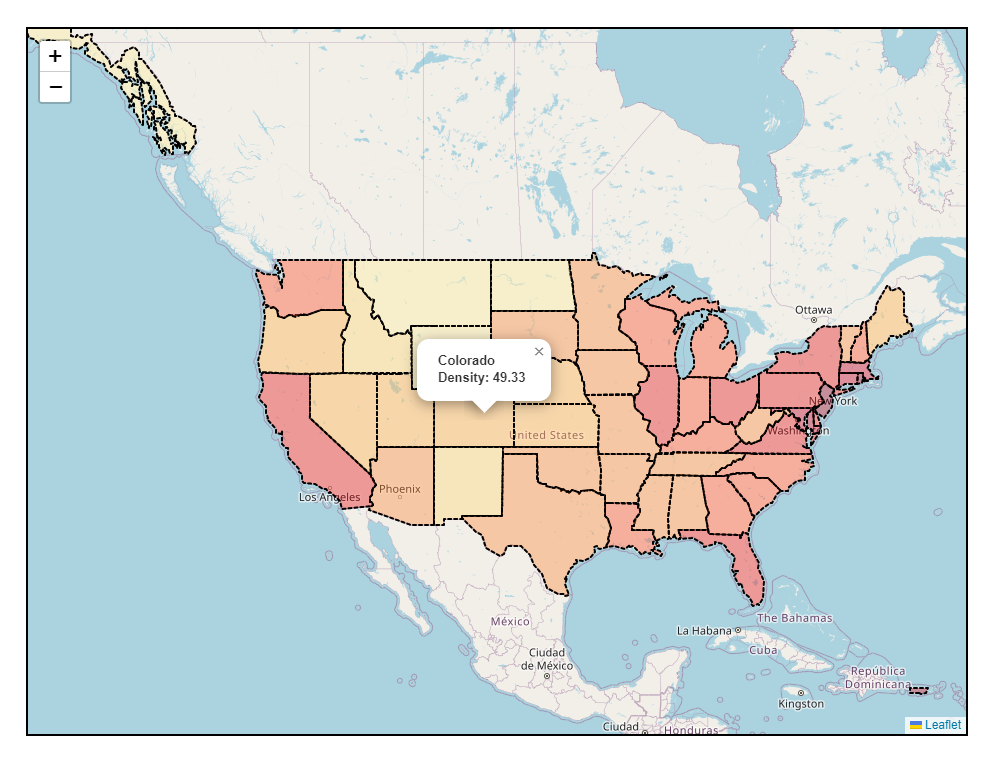
For this example we will build a map of the USA, with features to see the population and the name of the state when hovering, the states will be painted according to the number of inhabitants.
This is the example for a state that includes the type of map, id, properties where we put our information to be displayed, geometry type and coordinates.
All this is available in the Leafletjs documentation.
{
  "type": "FeatureCollection",
  "features": [
    {
      "type": "Feature",
      "id": "01",
      "properties": { "name": "Alabama", "density": 94.65 },
      "geometry": {
        "type": "Polygon",
        "coordinates": [
          [
            [-87.359296, 35.00118],
            ...
            [-87.359296, 35.00118]
          ]
        ]
      }
    },
Here is the full JSON we will use in this example.
Import our JSON data to a service to consume it in our component.
import { Injectable } from '@angular/core';
import { Observable, of } from 'rxjs';
import jsonData from '../../assets/data/us-state.json';
@Injectable({
  providedIn: 'root'
})
export class MapService {
  getMapData(): Observable<any> {
    return of(jsonData);
  }
}
Build the map
Finally, the last part renders the map with our JSON data and implements the features, we call our service and store the data in dataFromMap.
import { MapService } from 'src/app/services/map.service';

dataFromMap: any;
constructor( private _mapService: MapService ) {}

ngAfterViewInit(): void {
 this._mapService.getMapData().subscribe((res: any) => {
   this.dataFromMap = res;
   });
 this.initMap();
}
Then in the initMap function, we build the map, some highlights:
setView: The coordinates where the map view init.
titleLayer: The map textures to render in our map (valuable resource with some layers)
maxZoom: The zoom level that you want to start with on your map.
onEachFeature: A feature that you want to add to each property on your map.
  initMap(): void {
    const map = new Map('map').setView([41.5, -103.5], 4);
    tileLayer('https://tile.openstreetmap.org/{z}/{x}/{y}.png', {
      maxZoom: 19,
    }).addTo(map);

    geoJson(this.dataFromMap, {
      style: function (feature) {
        let color: string = feature?.properties.density > 1000 ? '#800026' :
          feature?.properties.density > 500 ? '#BD0026' :
            feature?.properties.density > 200 ? '#E31A1C' :
              feature?.properties.density > 100 ? '#FC4E2A' :
                feature?.properties.density > 50 ? '#FD8D3C' :
                  feature?.properties.density > 20 ? '#FEB24C' :
                    feature?.properties.density > 10 ? '#FED976' :
                      '#FFEDA0';;
        return {
          color: "black",
          weight: 2,
          fillColor: color,
          fillOpacity: 0.4,
          opacity: 1,
          dashArray: '3',
        };
      },
      onEachFeature: function (feature, layer) {
        layer.bindPopup("<strong>" + feature.properties.name + "</strong></br>" + "<strong>" + "Density: " + feature.properties.density + "</strong>");
      }
    }).addTo(map);
  }
In these lines you can see that we render our JSON data and we paint each state depending on the density, then we customise the styles a bit: colour, weight, fillColor, fillOpacity, opacity and dashArray.
Results
Conclusion
We have built a map with cool features in a few lines of code, Leafletjs has many features, in this example we only see ones, on the next articles we will dive into more features.


